Vantage CRM
A pipeline and reporting dashboard rebuilt around the metrics sales teams actually check daily.
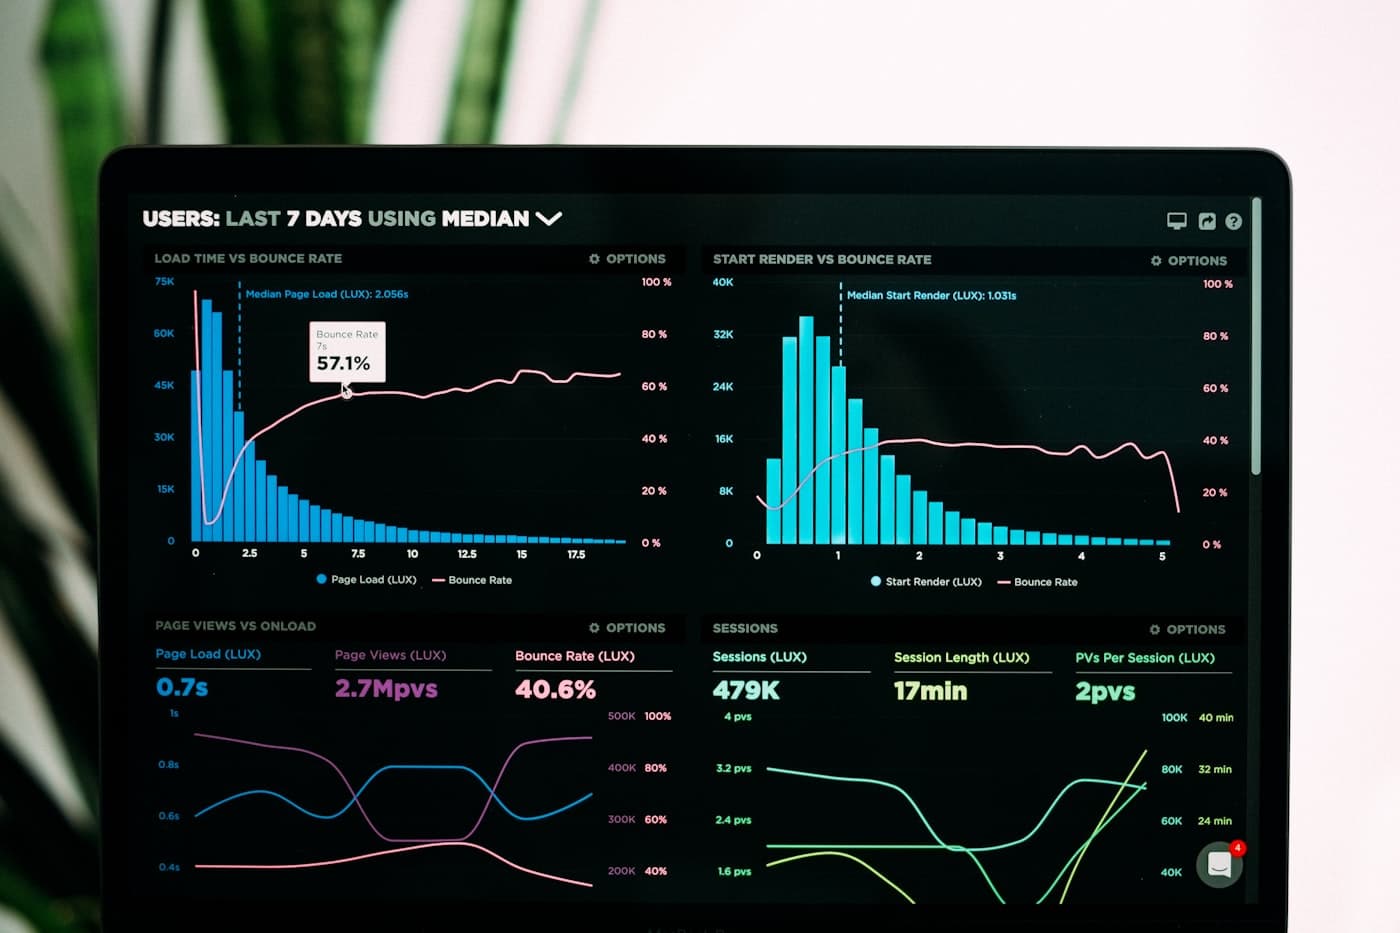
Vantage CRM's dashboard had grown feature by feature until sales teams could no longer find the numbers they actually needed each morning — the metrics that mattered were buried under ones that didn't.
The challenge was rebuilding the dashboard around real daily usage, without disrupting the pipeline data sales teams already depended on.
Product Design
Redesigning the dashboard around the metrics sales teams check every day.
Dashboard Development
Rebuilding the reporting layer as a fast, custom web application.
API Development
Structuring the pipeline data so the dashboard could stay fast at scale.
From problem to product.
Discover
Studied which metrics sales teams actually opened the dashboard to check.
Define
Scoped a rebuild around daily-use reporting instead of every possible metric.
Design
Designed a dashboard that surfaces pipeline health at a glance.
Build
Rebuilt the dashboard as a custom React application on a Laravel API.
Launch
Migrated existing pipeline data and rolled the new dashboard out to every sales team.
A dashboard built around what sales teams check daily.
The reporting dashboard — rebuilt around the pipeline metrics sales teams actually use.
The dashboard's layout, abstracted — the metrics that matter surfaced first, everything else a click away.
Built for what comes next.
A reporting dashboard engineered to stay fast as pipeline data grows.
Layer 01
Dashboard Layer
The sales-facing reporting interface — responsive, and built for daily use.
Layer 02
Pipeline Logic Layer
Deal, contact and pipeline logic exposed through a dedicated API.
Layer 03
Data & Reporting Layer
Pipeline data structured for fast, real-time reporting queries.
Layer 04
Hosting & Delivery Layer
Infrastructure tuned for a dashboard sales teams open dozens of times a day.
Technology Used
What was delivered.
Designed to work. Built to last.
A dashboard rebuilt around daily-use metrics changed how quickly sales teams could act on their pipeline — the numbers that mattered were finally the first thing they saw.
A closer look.
Pipeline dashboard, full viewReporting view, detail crop
Have something worth building?
Tell us what you’re working on and let’s figure out what’s next.